
Finance & fintech leaders
Put agents on real transactions and reconciliations with a chain of custody your auditors and regulators accept, on the core systems you already run.
Manta Graph™ is your estate's Relational Intelligence Graph — it diagnoses and builds a living map of how your systems actually relate: the leaks, the bottlenecks, and the highest-value fixes, before a token is spent.
Never train · no rip-and-replace · you own the blueprint and the custom MCP rails
Frontier Diagnostic Sprint or Analog-to-Digital Sprint — $7,500 standard environment / $10,000 regulated environment. Regulated carries more complexity, a wider risk surface, and more security scope, so the map and the controls do more work. One hundred percent of it credits toward your GW Slate™ build. You are buying the first stage of the thing itself. Diagnostic Sprint to begin → GW Slate™ Department from $25,000 → Sovereign Enterprise above that. Every step credits toward the next, and no step asks you to replace anything you already own.
What it maps
A clear diagnosis across your interconnected control layers — which systems are actually in play, where the culprits are (token waste, leaks, bottlenecks), what to optimize first, how intelligence scales across the estate, and where the data needs protecting.
Most pilots fail because siloed records are dumped straight into retrieval. Mapping relational topology first gives small local models the business context they need without a public-model dump.
Without a map, every hop re-sends context. The Compute & Token Economics artifact shows recovered spend before the controller is built.
Receipts can only prove what the map already named. Provenance sources are cells on the graph, named before generation.
Visual Topology for the board · Executable Schema for engineers · Compute & Token Economics for finance.
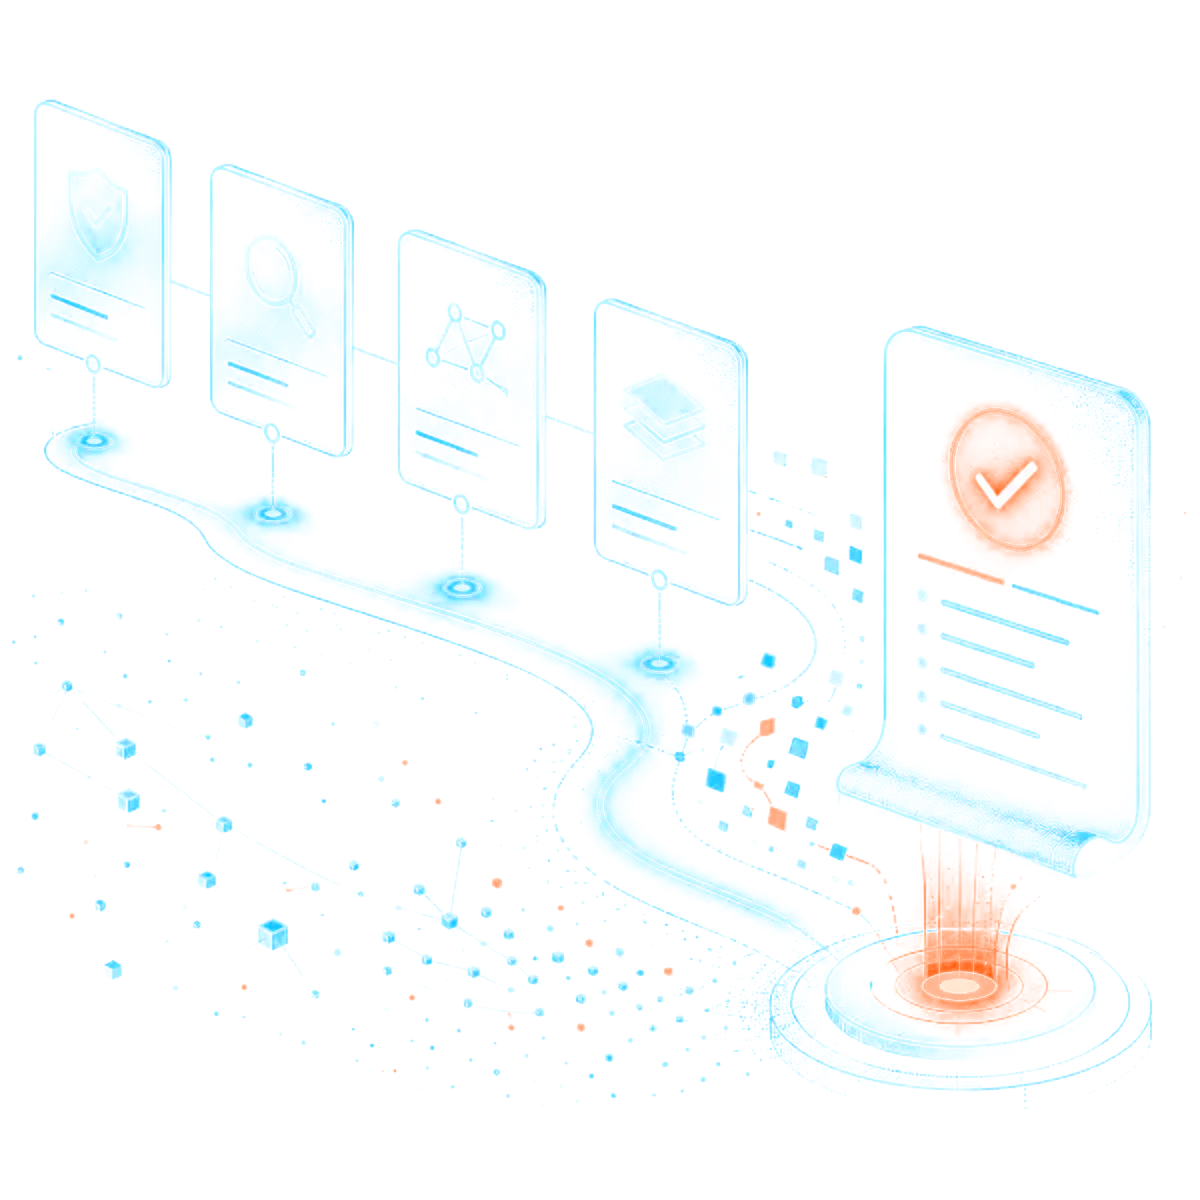
Any tech stack — from modern, future-ready setups through the deep-legacy systems a business still runs on. We map and integrate where you are today, so you modernize safely, at your own pace of play.
Put agents on real transactions and reconciliations with a chain of custody your auditors and regulators accept, on the core systems you already run.
Turn your archive and content into an intelligence engine that scales your voice and keeps your craft intact, with proof of origin on every output.
Compress cycle time across a workflow while your teams keep working in the systems they know.
Automate under the mandate, with data lineage and authority proof built in.
Underneath all of it, one interoperability fabric spanning modern SaaS, DAM, PIM, and ERP through the deep-legacy systems your business still depends on.
Manta Graph™ maps the estate that AEA™ prepares before inference.
Manta Graph™ maps it. GW Slate™ orchestrates it. Receipt Rail™ proves it.
Canonical pieces on this rail. Each magazine URL is the home; Substack is distribution.
A field guide to the eight tests a global asset passes when people and AI both read it, and how GeoLineage™ traces each one from legacy systems to every market.
Part 1 of Agent Topology. Fan-out and tiering replace a linear agent chain with a graph that sets what enterprise agents can execute.
Material developments in off-grid, sovereign, ruggedized, and intermittently connected AI—interpreted for enterprise operating decisions.
GlobalizeWe's design analogy for distributing agentic work across specialized, policy-aware Coral Reef Nodes™, each carrying a bounded role inside a governed mesh.
Agentic AI interoperability means agents exchange typed task state and coordinate action without losing identity, policy, provenance, or outcome accountability.
GW Slate™ is GlobalizeWe's modular controller for agentic AI — binding identity and policy, enforcing approval boundaries, and producing attributable receipts.
Infra before inference is mapping an enterprise's relational data topology with Manta Graph™ before applying large language models, so GW Slate™ can route the right task to the right model, stop agent looping, and secure data boundaries before a token is spent.
Manta Graph™ is the intake and diagnostic: a Relational Intelligence Graph that returns a visual topology, an executable schema, and compute-and-token economics before a model is chosen. It names token waste, data leaks, and bottlenecks, then proposes typed routes a small local model can run against. It never grants authority and never mints proof — GW Slate™ and Receipt Rail™ take those next.
Most pilots fail because messy legacy data is dumped straight into vector search. Mapping the relational topology first stops the bleed — token bloat, data leaks, and hallucination — before a token is spent.
Three tiers: a Visual Topology for the board, an Executable Schema for engineers, and Compute & Token Economics for finance — so recovered spend is sized before the controller is built.
Manta Graph™ maps any tech stack — from modern, future-ready setups through the deep-legacy systems a business still runs on — and we integrate where you are today so you modernize at your own pace of play.
Manta Graph™ returns a clear diagnosis across your interconnected control layers — which systems are actually in play, where the culprits are (token waste, leaks, bottlenecks), what to optimize first, how intelligence scales across the estate, and where the data needs protecting. Relational Intelligence Graph, applied to your situation.
GlobalizeWe never trains models on customer data. The Sprint ingests only anonymized system logs, API metadata, and schemas. Deployments run Hybrid by default, or on-prem or air-gapped by choice; your data stays yours.
$7,500 standard environment and $10,000 regulated environment, invoiced 100% upfront as a fully creditable retainer toward your GW Slate™ build. Flexible terms available for qualified engagements.
Fourteen days: the Manta Graph™ map plus a Micro-Proof, a demonstration run on your biggest workflow that produces two Actuality Receipts. $7,500 standard environment · $10,000 regulated environment · 100% creditable.